AMD vs Nvidia Return Calculator
Compare the same starting capital and contributions on dates available for both investments.
- Choose an amount.
- Set the observed dates.
- Review the result, risk and source.
$1,000 in each investment
2021-10-05 to 2026-10-02: AMD $6,226; Nvidia $11,440. Both exclude separately paid income and costs.
What the ending value hides
AMD's largest decline between closing observations in this window was -65.45%, from 2021-11-29 to 2022-10-14. The prior high was recovered on 2024-01-18, 780 days after the peak.
This is the full displayed source window, independent of calculator selections. Intraday losses may be larger; future losses can exceed historical drawdowns.
One-year holding periods
| Observed windows | Worst | Median | Best | Ended with a loss |
|---|---|---|---|---|
| 1003 | -59.76% | +38.42% | +371.13% | 29.8% |
Each observed purchase date is paired with the first observation on or after its one-year anniversary, up to seven days later. Windows overlap and are not independent trials. These historical frequencies are not probabilities of future outcomes.
What the ending value hides
Nvidia's largest decline between closing observations in this window was -66.36%, from 2021-11-29 to 2022-10-14. The prior high was recovered on 2023-05-25, 542 days after the peak.
This is the full displayed source window, independent of calculator selections. Intraday losses may be larger; future losses can exceed historical drawdowns.
One-year holding periods
| Observed windows | Worst | Median | Best | Ended with a loss |
|---|---|---|---|---|
| 1003 | -55.06% | +62.08% | +310.57% | 11.0% |
Each observed purchase date is paired with the first observation on or after its one-year anniversary, up to seven days later. Windows overlap and are not independent trials. These historical frequencies are not probabilities of future outcomes.
What differs between these investments?
AMD (AMD) provides exposure to semiconductors. Nvidia (NVDA) provides exposure to AI chips. Historical return alone does not measure business quality, future income or suitability.
Comparison calculations use only dates present in both sources. For stock/crypto comparisons, weekend-only crypto observations are omitted. Drawdowns therefore describe that common observation calendar, not every available crypto close.
AMD: Nasdaq historical data, fetched 2026-10-05. Provider closing prices; corporate-action adjustment treatment not independently verified
NVDA: Nasdaq historical data, fetched 2026-10-05. Provider closing prices; corporate-action adjustment treatment not independently verified
Another approach · Sponsored relationship
Considering automated trading alongside holding AMD or Nvidia?
Aurum trades actively rather than relying only on an asset's price rising. UBI.quest documents account screenshots and a completed withdrawal, and Aurum reports an average monthly return of 14% over a 12-month period.
Explore the recorded results and account context before deciding whether it fits your approach. The reported average is historical context: applying 14% to a new amount or future period is a projection, not another recorded account result.
- Inspect the dated evidence.
- Choose a loss limit you can afford.
- Test the withdrawal route before scaling.
Trading involves market, exchange and strategy risk. Future returns can be lower or negative. Evidence and methodology
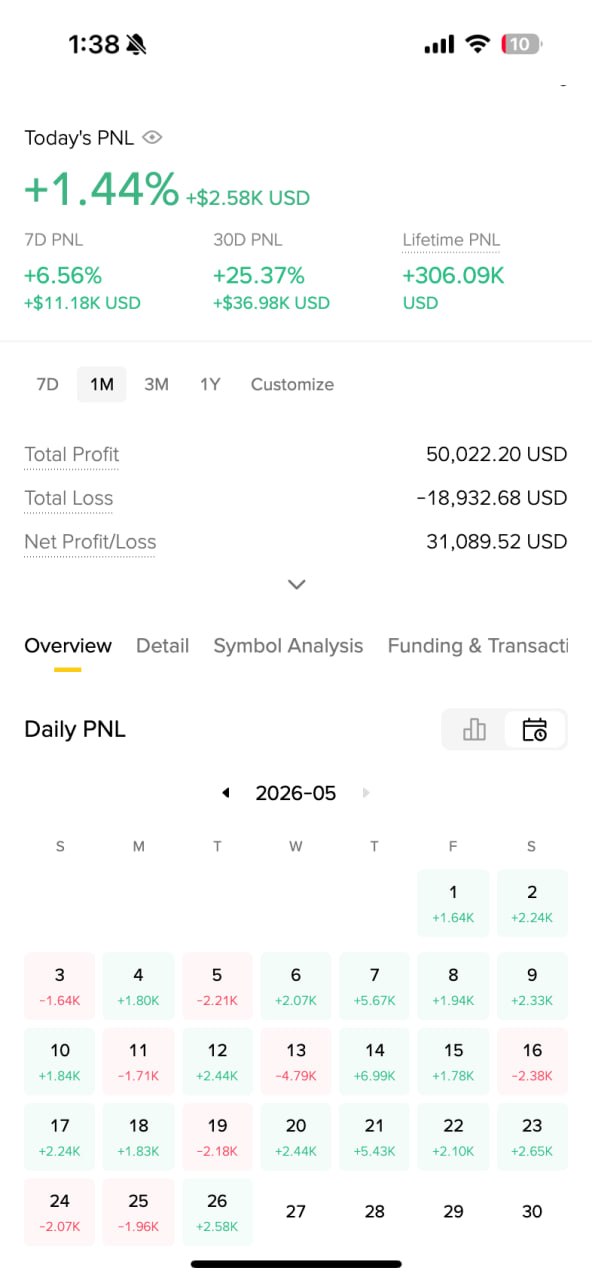 May 2026 account screenshot · View context