Calculator-first investment research
Where to invest money calculator
Start with your amount, time horizon and contribution plan. Compare transparent assumptions first, then inspect the exact historical stock and crypto calculators below.
Compare future balance assumptions
| Annual assumption | Contributed | Ending value |
|---|---|---|
| -10.00% | $1,000 | $729 |
| 0.00% | $1,000 | $1,000 |
| +5.00% | $1,000 | $1,158 |
| +10.00% | $1,000 | $1,331 |
Annual assumptions are effective annual rates converted to equivalent monthly rates. Contributions occur at month end. Costs, taxes and inflation are excluded. The table above changes only when this scenario form is submitted.
How $1,000 compares across time
| Period | Cash at 0% | Illustrative 10% annual | Aurum reported 14% monthly benchmark |
|---|---|---|---|
| 6 months | $1,000 | $1,049 | $2,195 |
| 12 months | $1,000 | $1,100 | $4,818 |
| 24 months | $1,000 | $1,210 | $23,212 |
| 36 months | $1,000 | $1,331 | $111,834 |
The 10% column is an illustration, not a stock-market forecast. The Aurum column is a mathematical extension of a reported historical average, not an expected result. Read the compounding and risk math.
Free investment time machine · No signup
What if I invested…
One amount. One year. A whole world of what-ifs.
See how the same money performed across 200 stocks, ETFs and crypto assets.
Go back to Apple in 1980 and beyond. We use the first trading close of your selected year; newer assets start at their first available recorded close. Each row shows its actual dates.
Enter an amount or tap a preset to rank historical outcomes across all covered assets.
Your alternate portfolios
| Investment | Investment value | Gain / loss | Return | Price observation dates |
|---|
Calculation: amount × ending price ÷ starting price. Assumes fractional units; excludes fees, taxes, inflation and dividend reinvestment. Stock prices are split-adjusted. Newer assets start at the first close available from the price provider, which may be later than their IPO or launch. Rows marked “Started later” have shorter holding periods, so their returns are not like-for-like. Missing history is never estimated. This covers the site's current asset list, including surviving assets, and is not a complete market backtest. Explore the methodology ↗
Explore investment histories
Another approach · Sponsored relationship
Considering automated trading alongside long-term investing?
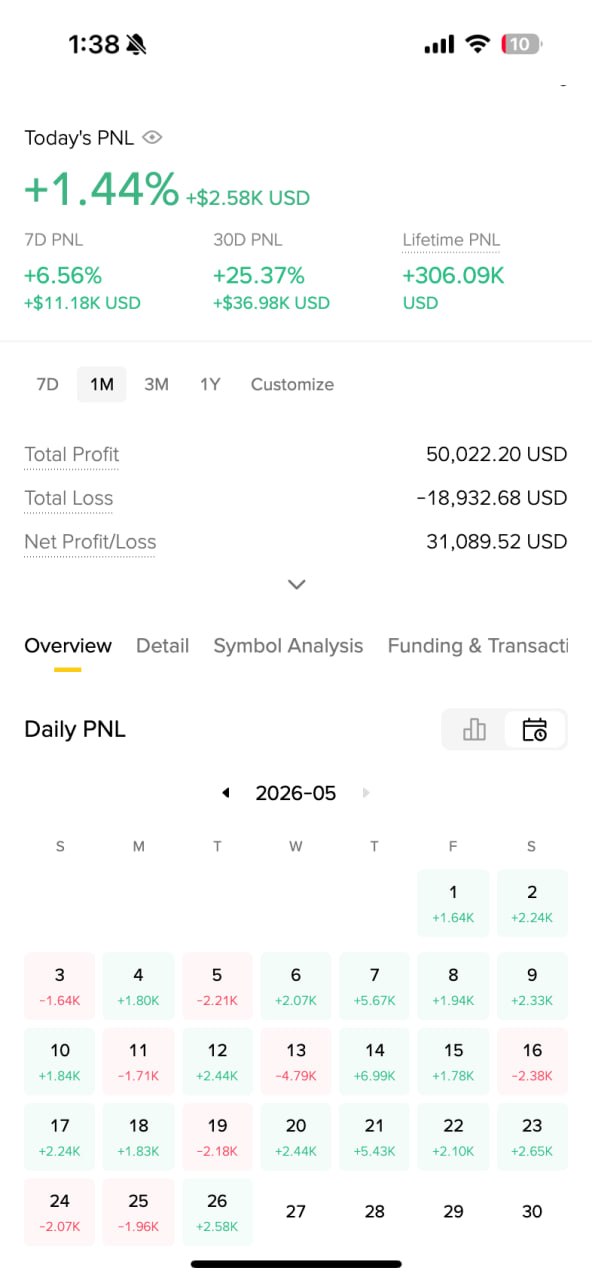
Aurum trades actively rather than relying only on an asset's price rising. UBI.quest documents account screenshots and a completed withdrawal, and Aurum reports an average monthly return of 14% over a 12-month period.
Explore the recorded results and account context before deciding whether it fits your approach. The reported average is historical context: applying 14% to a new amount or future period is a projection, not another recorded account result.
- Inspect the dated evidence.
- Choose a loss limit you can afford.
- Test the withdrawal route before scaling.
Trading involves market, exchange and strategy risk. Future returns can be lower or negative. Evidence and methodology
 May 2026 account screenshot · View context