Crypto / UNI
Uniswap Return Calculator
$1,000 invested between 2021-09-06 and 2026-09-15 became $221 before costs and excluded income. Adjust the amount and dates below.
Your historical investment
2021-09-06 to 2026-09-15. Annualized price return: -25.96%.
Purchase fees $0. Price return and CAGR describe the asset, not a money-weighted return on contributions.
Price observations and investment values
| Date | Value | Contributed |
|---|
Historical amounts at a glance
| Invested | Ending value | Gain / loss | Price return |
|---|---|---|---|
| $100 | $22 | -$78 | -77.90% |
| $1,000 | $221 | -$779 | -77.90% |
| $10,000 | $2,210 | -$7,790 | -77.90% |
What the ending value hides
Uniswap's largest decline between closing observations in this window was -91.70%, from 2021-09-06 to 2026-06-10. That high had not been recovered by 2026-09-15.
This is the full displayed source window, independent of calculator selections. Intraday losses may be larger; future losses can exceed historical drawdowns.
One-year holding periods
| Observed windows | Worst | Median | Best | Ended with a loss |
|---|---|---|---|---|
| 1471 | -81.44% | -25.07% | +193.44% | 62.7% |
Each observed purchase date is paired with the first observation on or after its one-year anniversary, up to seven days later. Windows overlap and are not independent trials. These historical frequencies are not probabilities of future outcomes.
Against Bitcoin on matching dates
From 2021-09-06 to 2026-09-15, a one-off $1,000 became $221 in this asset and $1,437 in Bitcoin. The price-return difference was -121.56 percentage points.
Both use the dates available in both series, no contributions or fees, and exclude separately paid income. This fixed comparison uses the shared full window. It does not change with the form above.
Bitcoin calculator · Benchmark price sourceUNI calculation questions
Does this include dividends or staking rewards?
No separately paid income is added. The displayed result is price-based; it is not a dividend-reinvested total return or a staking return.
Why can another calculator show a different number?
Different purchase dates, closing versus intraday prices, source adjustments, fees and dividend treatment change results. Use the exact dates and source linked here to compare like with like.
Can I use the historical annualized return as a forecast?
The historical CAGR describes this particular starting and ending price. It does not establish the rate a future investment will earn. Explore hypothetical return assumptions separately.
Model a future UNI investment
These are your hypothetical assumptions, not an analyst price target or a forecast derived from Uniswap's past return. Compare negative, flat and positive outcomes.
| Annual assumption | Contributed | Ending value |
|---|---|---|
| -10.00% | $1,000 | $729 |
| 0.00% | $1,000 | $1,000 |
| +5.00% | $1,000 | $1,158 |
| +10.00% | $1,000 | $1,331 |
Annual assumptions are effective annual rates converted to equivalent monthly rates. Contributions occur at month end. Costs, taxes and inflation are excluded. The table above changes only when this scenario form is submitted.
Data and calculation notes
USD display. Fractional units are assumed. Taxes, sale fees and income paid outside the price series are excluded. Cached observations are not live quotes.
For date selection, purchases use the first available observation on or after the start date and valuation uses the last observation on or before the end date. No prices are interpolated. Source gaps can affect results. Methodology 2026-09-16.1
Related calculators
Another approach · Sponsored relationship
Considering automated trading alongside holding Uniswap?
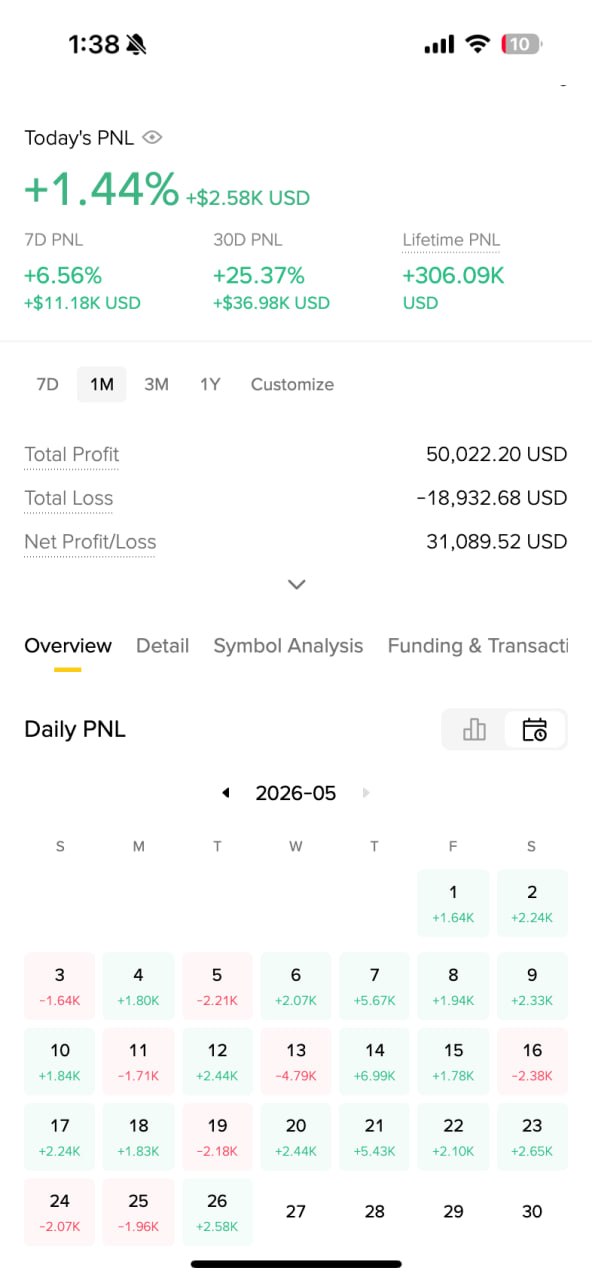
Aurum trades actively rather than relying only on an asset's price rising. UBI.quest documents account screenshots and a completed withdrawal, and Aurum reports an average monthly return of 14% over a 12-month period.
Explore the recorded results and account context before deciding whether it fits your approach. The reported average is historical context: applying 14% to a new amount or future period is a projection, not another recorded account result.
Trading involves market, exchange and strategy risk. Future returns can be lower or negative. Evidence and methodology
 May 2026 account screenshot · View context